



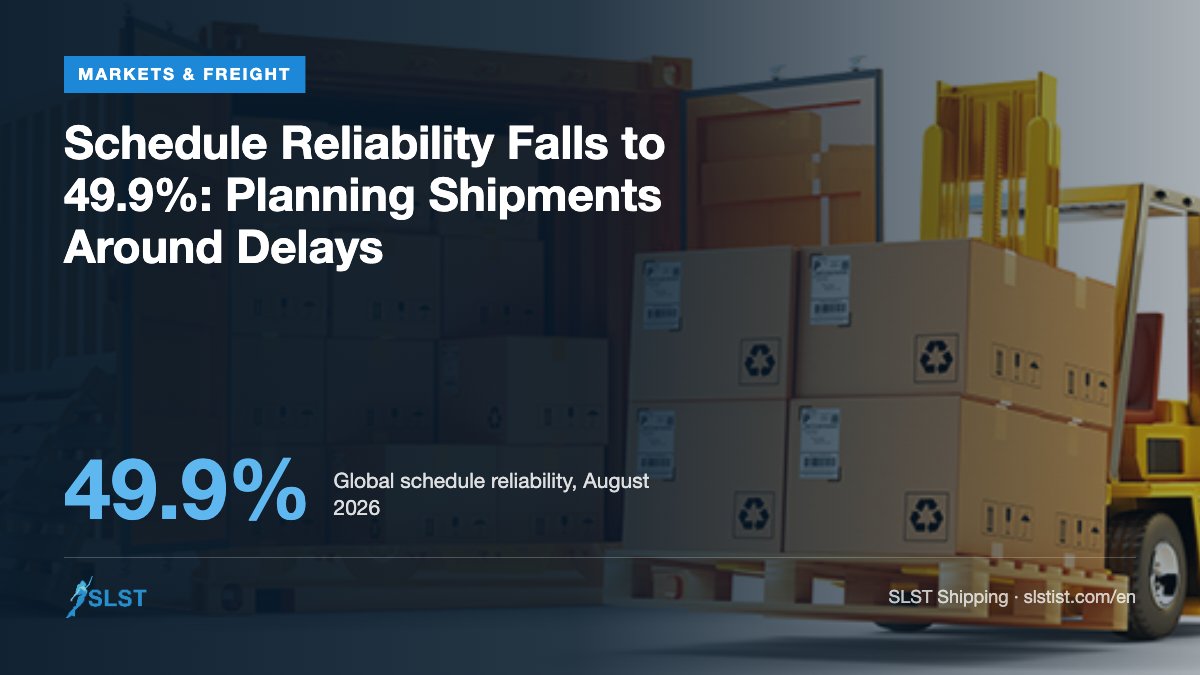
Schedule reliability, the share of container ships arriving according to schedule, has been trending down in 2026. According to the report Sea-Intelligence published at the end of September, only half of ships arrived on time in August.
August 2026 figures
- Global schedule reliability: 49.9%, the lowest level since September 2022. In July it was 56.4%.
- Average delay: Late vessels arrived 6.81 days late on average, the highest since March 2022.
- Main cause: Sea-Intelligence attributes the decline to port congestion in Asia.
By carrier and alliance
| Carrier (August 2026) | Reliability |
|---|---|
| Maersk | 67.3% (highest) |
| Hapag-Lloyd | 61.5% |
| MSC | 55.2% |
| CMA CGM | 50.6% |
| Wan Hai | 23.2% (lowest) |
Among alliances, Gemini (77.8%) was the most reliable on a July–August average, followed by MSC (70.1%), Ocean Alliance (48.3%) and Premier Alliance (43.2%). None of the top 13 carriers improved year on year.
What does it mean for cargo owners?
Schedule reliability of around 50% means that one in two shipments arrives on a different day than planned. Practical consequences:
- Production and sales planning: Raw materials or sales stock may arrive late.
- Extra cost: Containers staying at the port or with the customer beyond free time can trigger demurrage and detention charges.
- Transshipment risk: On transshipped cargo, a delay can mean missing the connecting vessel.
Five tips against delays
- Build in buffer time: Add extra days to delivery dates for critical cargo.
- Negotiate free time: Ask about free time at the destination port at the quotation stage.
- Consider direct services: Services without transshipment shorten the chain of delays.
- Track: Check the line’s tracking system or your agent’s notifications regularly.
- Be flexible with part loads: For cargo that does not fill a container, LCL/consolidation can make it easier to split shipments into smaller, more frequent lots.
Frequently asked questions
How is schedule reliability measured?
Sea-Intelligence measures whether ships arrive within a set tolerance of the scheduled date and reports the share of on-time arrivals as a percentage.
What is the difference between demurrage and detention?
Demurrage is charged when a full container stays at the port beyond free time; detention is charged when a container is returned late to the line after leaving the port. Practice varies by line.
Sources
- Sea-Intelligence: Press room
- World Cargo News: Sea-Intelligence – schedule reliability falls to 2026 low
- Global Maritime Hub: Global schedule reliability drops below 50% in August
This article is based on sources published up to 26 October 2026.

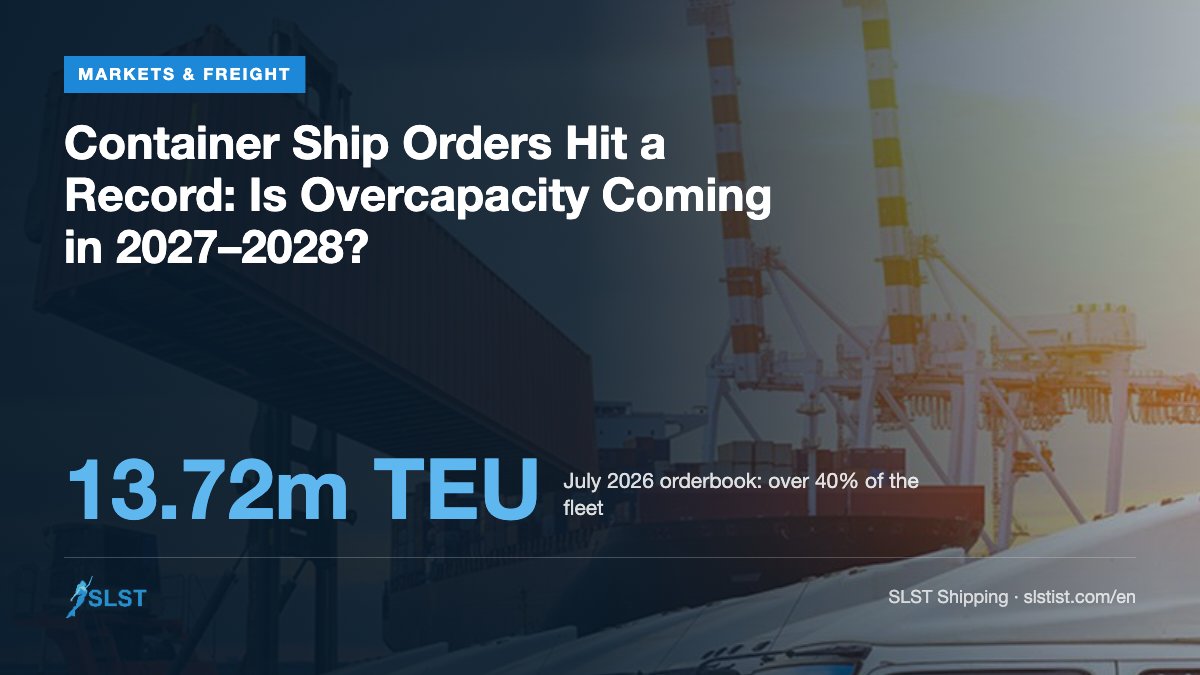
Container lines launched a historic ordering wave in 2025 and 2026. The orderbook, the total capacity of ships waiting to be built at shipyards, reached record levels in 2026. The question most asked in the industry now: what will happen to freight rates when these ships are delivered?
The figures
- May 2026: According to Linerlytica, the orderbook reached about 13 million TEU, equal to 38.3% of the existing fleet, a ratio not seen since the global financial crisis.
- July 2026: The orderbook set a new record at 1,712 ships and 13.72 million TEU, exceeding 40% of the fleet.
- Ordering pace: New orders placed in the first four months of 2026 exceeded 1.9 million TEU. At this pace, the 2025 record of 5.1 million TEU is expected to be broken by year-end.
- Shipyards: About eight in ten ships on order are at Chinese yards.
When will they be delivered?
Most of the new capacity will be delivered in 2027 and 2028:
- Alphaliner calculates that a total of 1,000 newbuildings with 8.5 million TEU of capacity will enter the market in 2027 and 2028.
- Linerlytica expects deliveries in 2028 alone to exceed 5.5 million TEU if all yard slots are filled.
Why is there no overcapacity yet?
Jonathan Roach of Braemar describes the market’s current strength as “borrowed”. Ships sailing around the Cape of Good Hope because of the Red Sea crisis tied up a large part of the fleet on long voyages. As the return to Suez accelerates, this capacity will be released. With new deliveries added, the supply side is expected to drive the market.
Possible consequences for cargo owners
- Pressure on rates: If supply grows faster than demand, freight rates may come under downward pressure.
- Contract negotiations: Companies negotiating long-term rates for 2027 can take expected capacity into account.
- Service changes: In periods of overcapacity, lines may use blank sailings and service mergers, affecting transit times and schedules.
Forecasts are not certain, however: the security situation in the Red Sea, the pace of ship recycling and global trade demand may change the picture.
Frequently asked questions
What is an orderbook?
The total of ships ordered from shipyards but not yet delivered, usually expressed as the number of ships and TEU capacity.
Will new ships definitely lower freight rates?
Not definitely. Supply growth may put pressure on rates, but demand, route changes and recycling also determine the outcome.
Sources
- Riviera: Record-smashing box ship orderbook fuels overcapacity concerns
- Global Trade: Container ship orderbook hits record 13 million TEU
- Kuehne+Nagel: Containership orders hit record high despite looming overcapacity fears
- Logistics Management: Top 30 ocean carriers 2026 – walking a capacity tightrope
This article is based on sources published up to 26 October 2026.
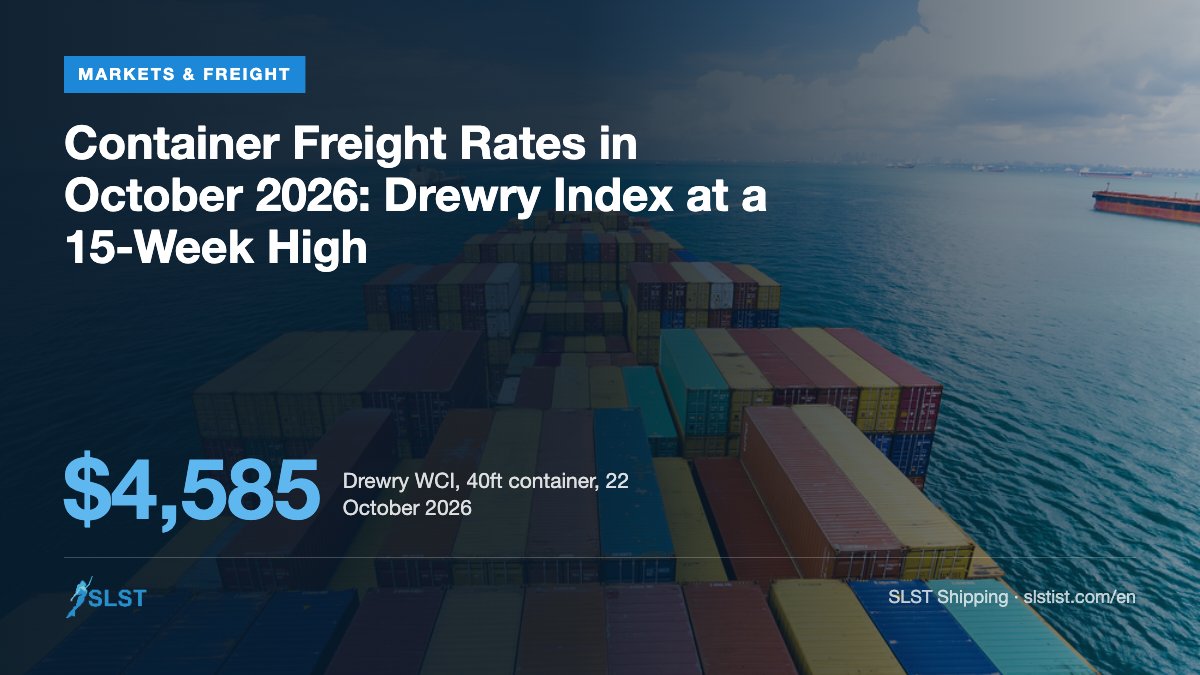
One of the most common ways to track container freight rates is Drewry’s weekly World Container Index (WCI). The index shows the average 40ft container spot rate on 8 major east–west trades. In October 2026 the index started rising again.
The index in October
| Date | WCI composite (per 40ft) |
|---|---|
| 1 October 2026 | $4,434 |
| 8 October 2026 | $4,351 |
| 15 October 2026 | $4,485 |
| 22 October 2026 | $4,585 |
On 22 October the composite index rose 2% week on week to $4,585, its highest level in 15 weeks.
Shanghai–Genoa: the Mediterranean benchmark
The index does not include a direct trade to Turkey. The closest benchmark for Asia–Mediterranean rates is the Shanghai–Genoa trade, where the 40ft rate rose 5% week on week to $4,152 on 22 October.
This figure is not a “Turkey price”. Transshipment, service structure and port charges change the price of cargo to Turkish ports. But it is useful as a direction: when Asian rates to the Mediterranean rise, cargo to Turkey is usually affected the same way.
What is driving rates?
- Return to Suez: Lines are gradually returning to the Red Sea. In the long run this releases capacity; in the short run service changes make rates volatile.
- Schedule reliability: Global schedule reliability fell to 49.9% in August. Delays reduce the capacity ships can actually carry.
- Surcharges: Freight is not only the base rate. Bunker surcharges, EU ETS surcharges, fuel charges linked to the Mediterranean ECA and war risk surcharges may be added to a quote.
Spot rates versus contract rates
The index measures spot rates. Companies shipping regularly and in high volumes usually negotiate fixed-term contract rates with lines. When spot rates rise, contract rates may not move at the same speed. Which structure suits you depends on your volumes and shipping pattern.
When comparing quotes
- Are the quotes for the same equipment (20′, 40′, 40′ HC)? See our Container Dimensions page.
- Which surcharges are included and which are excluded?
- How long is the quote valid?
- The delivery term (Incoterms) determines who pays the freight: Incoterms.
Frequently asked questions
Can I use the Drewry index price for Turkey?
Not directly. The index measures spot rates between specific ports. It can be used as a directional indicator for Turkey; an actual price requires a quote.
How often is the index published?
Drewry’s WCI is updated every Thursday.
Sources
This article is based on sources published up to 26 October 2026.